Here’s some GST_DEBUG=4 output:
0:00:07.357204693 3453534 0x7efca4002060 INFO GST_EVENT gstevent.c:1687:gst_event_new_reconfigure: creating reconfigure event
0:00:07.357220398 3453534 0x7efca4002060 INFO GST_EVENT gstevent.c:918:gst_event_new_caps: creating caps event application/x-rtcp, ssrc=(uint)1758363959
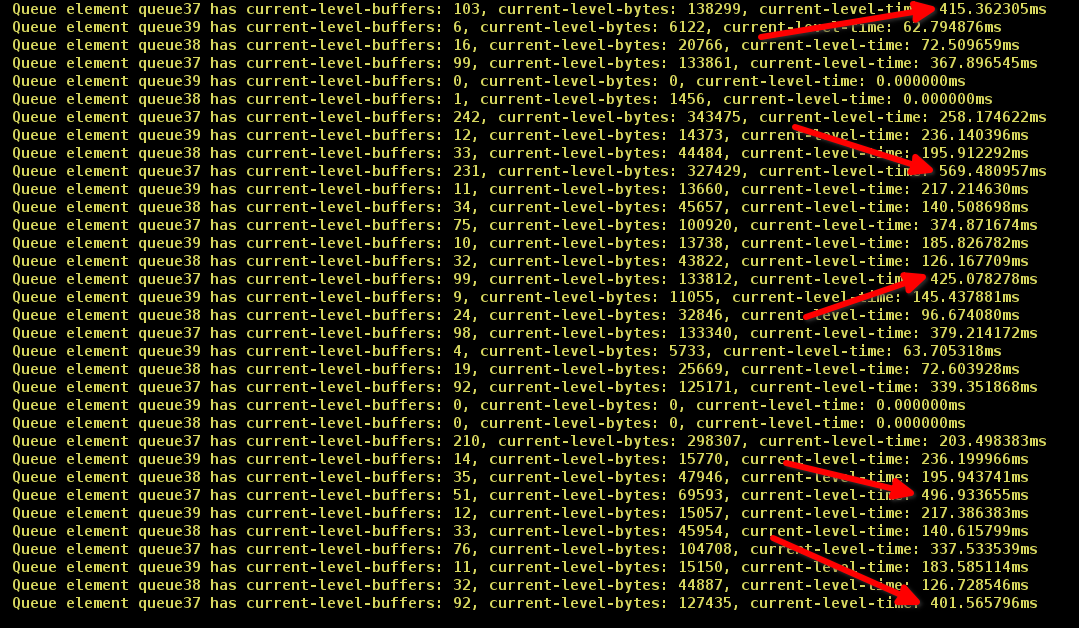
TRACE: Queue element queue1 has current-level-buffers: 1, current-level-bytes: 1456, current-level-time: 37.187862ms
TRACE: Queue element queue1 has current-level-buffers: 1, current-level-bytes: 1456, current-level-time: 36.636688ms
TRACE: Queue element queue1 has current-level-buffers: 1, current-level-bytes: 1456, current-level-time: 36.037617ms
TRACE: Queue element queue1 has current-level-buffers: 1, current-level-bytes: 1456, current-level-time: 37.655727ms
TRACE: Queue element queue1 has current-level-buffers: 1, current-level-bytes: 1456, current-level-time: 39.592674ms
TRACE: Queue element queue1 has current-level-buffers: 1, current-level-bytes: 1456, current-level-time: 39.899487ms
TRACE: Queue element queue1 has current-level-buffers: 1, current-level-bytes: 1456, current-level-time: 39.996662ms
0:00:08.871996844 3453534 0x7efc94040920 INFO GST_EVENT gstevent.c:918:gst_event_new_caps: creating caps event application/x-rtcp
0:00:08.872095909 3453534 0x7efc94040920 INFO GST_EVENT gstevent.c:998:gst_event_new_segment: creating segment event time segment start=0:00:00.000000000, offset=0:00:00.000000000, stop=99:99:99.999999999, rate=1.000000, applied_rate=1.000000, flags=0x00, time=0:00:00.000000000, base=0:00:00.000000000, position 0:00:00.000000000, duration 99:99:99.999999999
TRACE: Queue element queue1 has current-level-buffers: 1, current-level-bytes: 1456, current-level-time: 39.999985ms
TRACE: Queue element queue1 has current-level-buffers: 1, current-level-bytes: 1456, current-level-time: 40.000000ms
TRACE: Queue element queue1 has current-level-buffers: 1, current-level-bytes: 1456, current-level-time: 40.000000ms
TRACE: Queue element queue1 has current-level-buffers: 1, current-level-bytes: 28, current-level-time: 40.000000ms
0:00:09.634637891 3453534 0x7efc94040a40 INFO GST_EVENT gstevent.c:918:gst_event_new_caps: creating caps event application/x-rtcp
0:00:09.634685525 3453534 0x7efc94040a40 INFO GST_EVENT gstevent.c:998:gst_event_new_segment: creating segment event time segment start=0:00:00.000000000, offset=0:00:00.000000000, stop=99:99:99.999999999, rate=1.000000, applied_rate=1.000000, flags=0x00, time=0:00:00.000000000, base=0:00:00.000000000, position 0:00:00.000000000, duration 99:99:99.999999999
TRACE: Queue element queue1 has current-level-buffers: 1, current-level-bytes: 1456, current-level-time: 40.000000ms
0:00:09.745097322 3453534 0x7efc940409e0 INFO GST_EVENT gstevent.c:918:gst_event_new_caps: creating caps event application/x-rtcp
0:00:09.745136915 3453534 0x7efc940409e0 INFO GST_EVENT gstevent.c:998:gst_event_new_segment: creating segment event time segment start=0:00:00.000000000, offset=0:00:00.000000000, stop=99:99:99.999999999, rate=1.000000, applied_rate=1.000000, flags=0x00, time=0:00:00.000000000, base=0:00:00.000000000, position 0:00:00.000000000, duration 99:99:99.999999999
TRACE: Queue element queue1 has current-level-buffers: 1, current-level-bytes: 1456, current-level-time: 40.000000ms
TRACE: Queue element queue1 has current-level-buffers: 1, current-level-bytes: 1456, current-level-time: 40.000000ms
<...>
TRACE: Queue element queue1 has current-level-buffers: 1, current-level-bytes: 1456, current-level-time: 40.004978ms
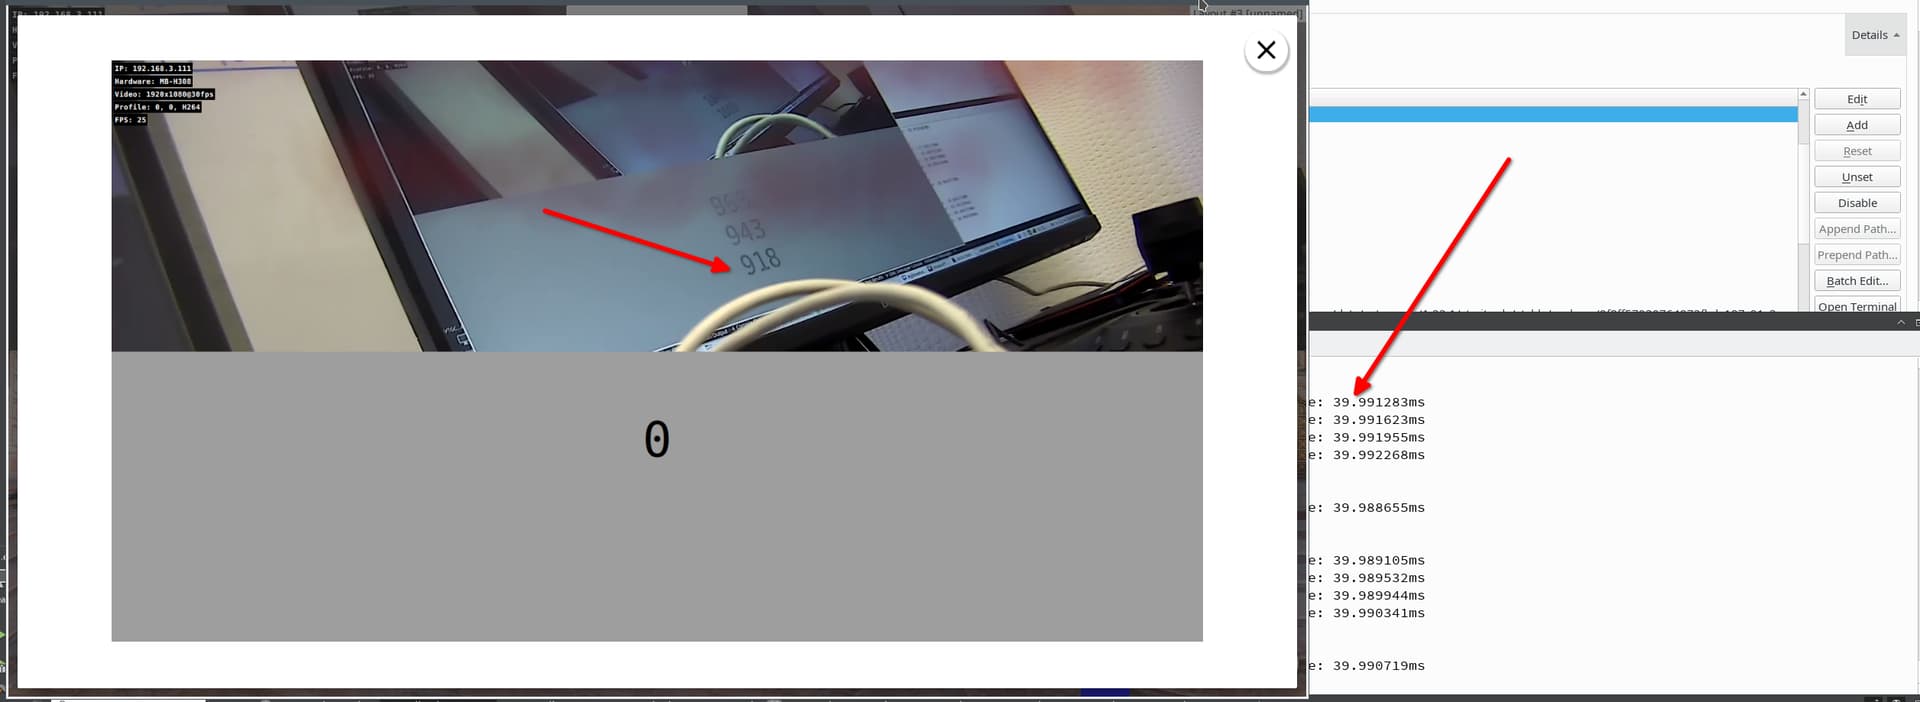
0:00:12.379029553 3453534 0x7efcb4002180 WARN videodecoder gstvideodecoder.c:3152:gst_video_decoder_prepare_finish_frame:<vah264dec1> decreasing timestamp (0:00:05.515782607 < 0:00:05.516059995)
TRACE: Queue element queue1 has current-level-buffers: 1, current-level-bytes: 1456, current-level-time: 40.004745ms
TRACE: Queue element queue1 has current-level-buffers: 1, current-level-bytes: 1456, current-level-time: 40.004559ms
Maybe decreasing timestamp message says something?