I have some remote IoT devices that I routinely remote into via Tailscale and view the camera feeds. However, this suddenly stopped working and I cannot seem to figure out what is going on.
IoT device: Ubuntu 18.04 Jetson nano with GStreamer 1.14.5
Client: Windows 11 with GStreamer 1.24.10
IoT Pipeline: gst-launch-1.0 -v audiotestsrc ! udpsink host=100.72.23.20 port=5055
Client Pipeline #1: gst-launch-1.0.exe udpsrc port=5055 ! fakesink dump=TRUE
Client Pipeline #2: gst-launch-1.0.exe udpsrc address="100.72.23.20" port=5055 ! fakesink dump=TRUE
Logs with set GST_DEBUG=2,*udp*:6
Use Windows high-resolution clock, precision: 1 ms
Setting pipeline to PAUSED ...
0:00:00.053310700 31588 000001B09E109450 DEBUG                 udpsrc gstudpsrc.c:1602:gst_udpsrc_open:<udpsrc0> allocating socket for 0.0.0.0:5055
0:00:00.055869600 31588 000001B09E109450 DEBUG                 udpsrc gstudpsrc.c:1546:gst_udpsrc_resolve:<udpsrc0> IP address for host 0.0.0.0 is 0.0.0.0
0:00:00.058817400 31588 000001B09E109450 DEBUG                 udpsrc gstudpsrc.c:1615:gst_udpsrc_open:<udpsrc0> got socket 000001B09E140190
0:00:00.061211200 31588 000001B09E109450 DEBUG                 udpsrc gstudpsrc.c:1622:gst_udpsrc_open:<udpsrc0> binding on port 5055
0:00:00.063829500 31588 000001B09E109450 INFO                  udpsrc gstudpsrc.c:1727:gst_udpsrc_open:<udpsrc0> have udp buffer of 65536 bytes
0:00:00.065777700 31588 000001B09E109450 DEBUG                 udpsrc gstudpsrc.c:1888:gst_udpsrc_open:<udpsrc0> bound, on port 5055
Pipeline is live and does not need PREROLL ...
Pipeline is PREROLLED ...
Setting pipeline to PLAYING ...
0:00:00.069270900 31588 000001B09E13B200 LOG                   udpsrc gstudpsrc.c:1961:gst_udpsrc_unlock_stop:<udpsrc0> No longer flushing
New clock: GstSystemClock
0:00:00.071370900 31588 000001B09E13B200 LOG                   udpsrc gstudpsrc.c:1024:gst_udpsrc_fill:<udpsrc0> doing select, timeout -1
handling interrupt.
Interrupt: Stopping pipeline ...
Execution ended after 0:00:20.959240100
Setting pipeline to NULL ...
0:00:21.029007400 31588 000001B09E109450 LOG                   udpsrc gstudpsrc.c:1946:gst_udpsrc_unlock:<udpsrc0> Flushing
0:00:21.030456900 31588 000001B09E13B200 DEBUG                 udpsrc gstudpsrc.c:1231:gst_udpsrc_fill: stop called
0:00:21.030530400 31588 000001B09E109450 LOG                   udpsrc gstudpsrc.c:1946:gst_udpsrc_unlock:<udpsrc0> Flushing
0:00:21.033495200 31588 000001B09E109450 LOG                   udpsrc gstudpsrc.c:1961:gst_udpsrc_unlock_stop:<udpsrc0> No longer flushing
0:00:21.035204200 31588 000001B09E109450 DEBUG                 udpsrc gstudpsrc.c:1974:gst_udpsrc_close: closing sockets
Freeing pipeline ...
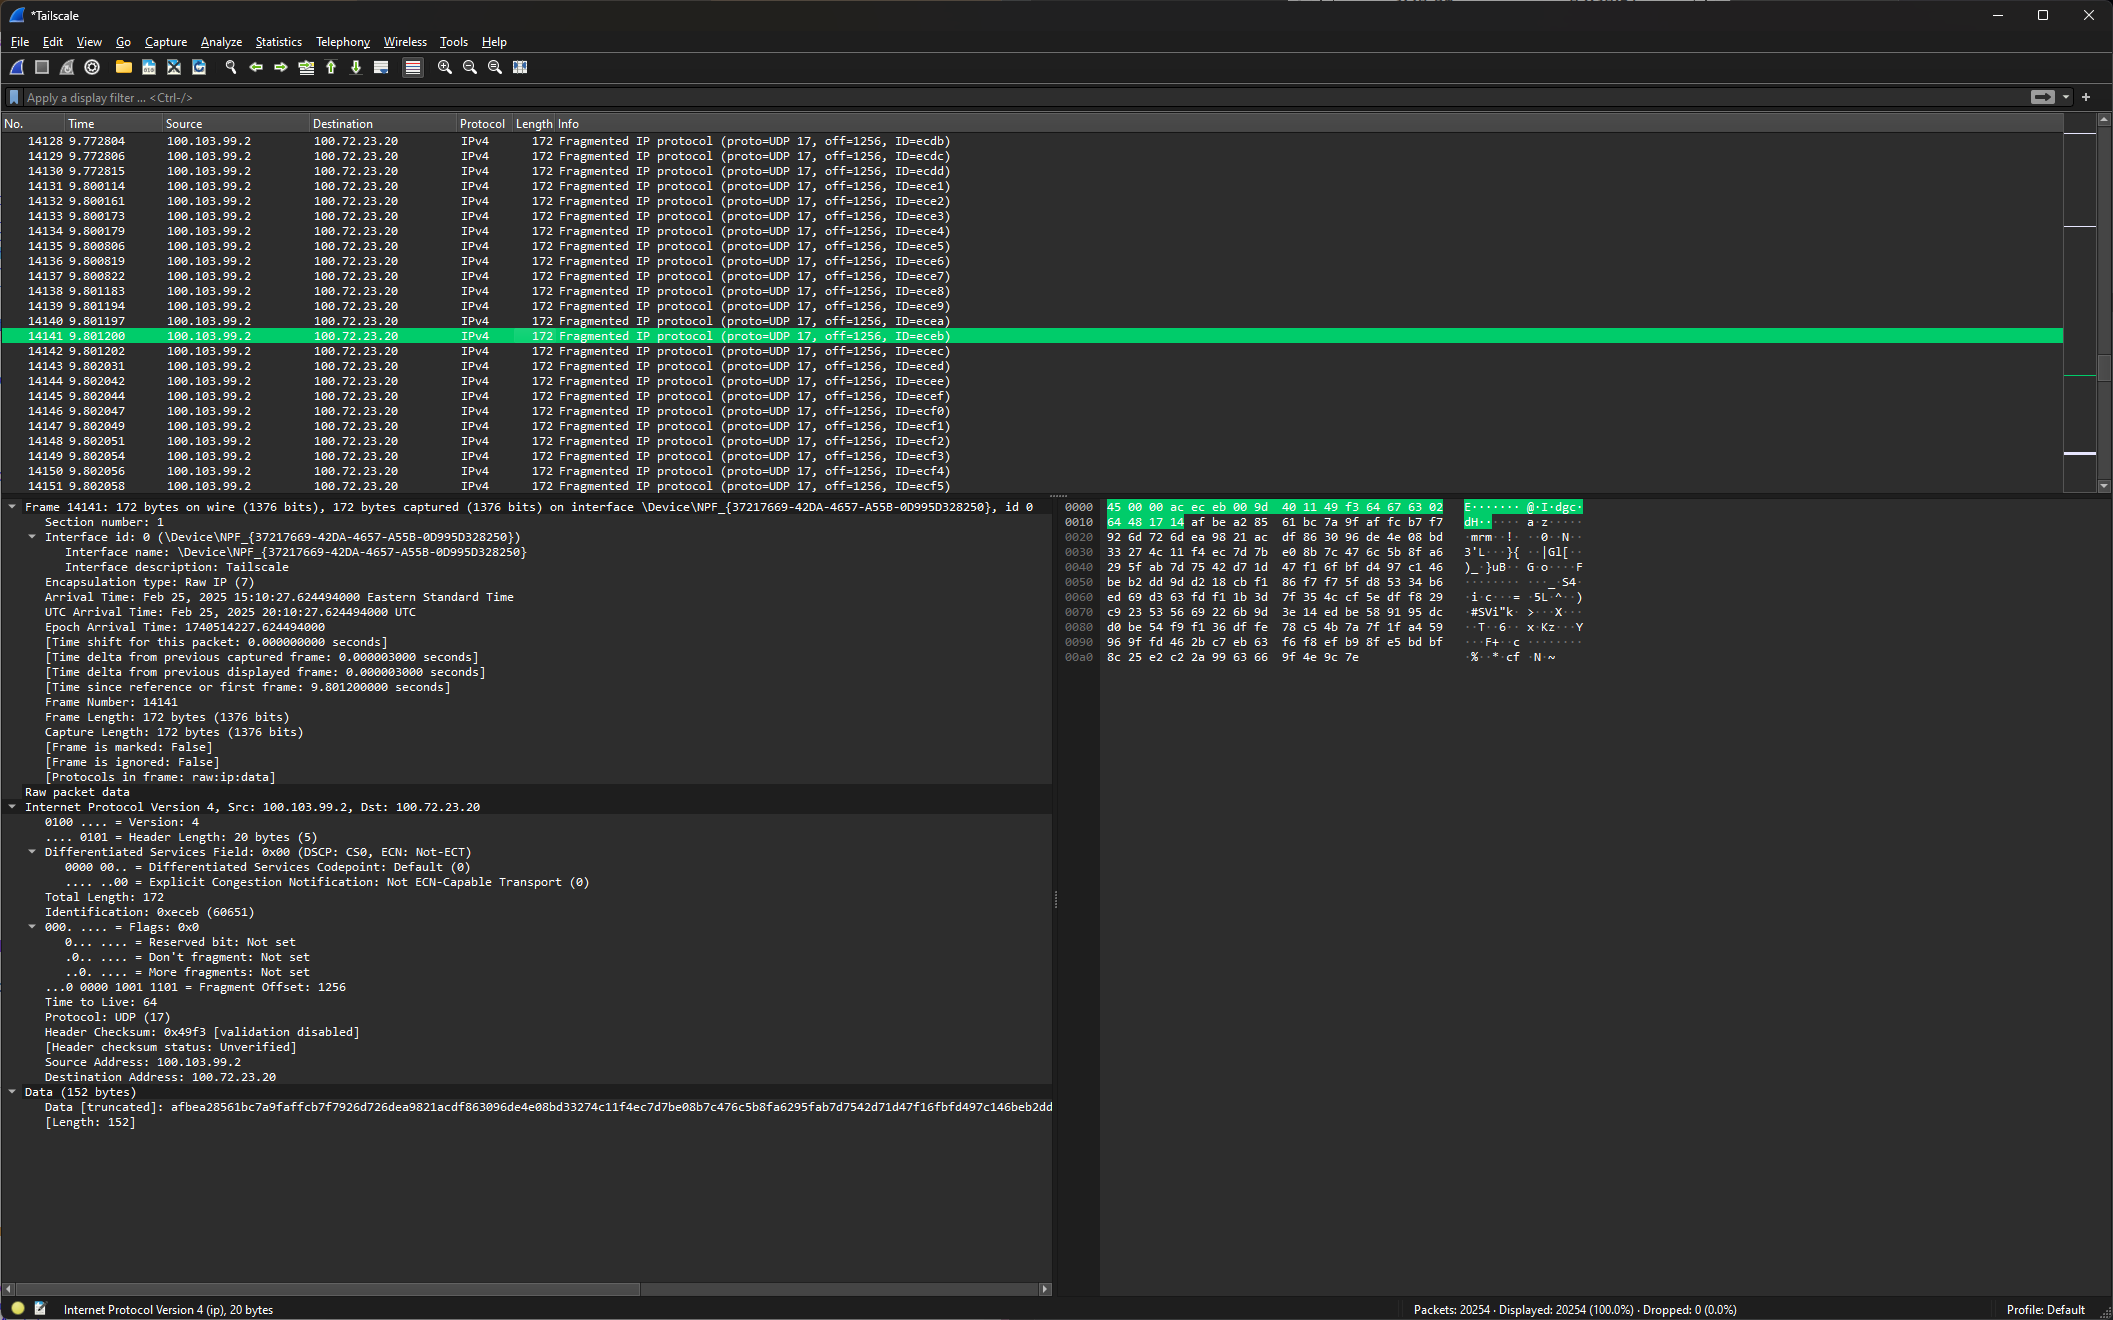
I know the data is being received by my computer (otherwise I would’ve leaned toward this being a Tailscale issue) because packet data shows up in wireshark and Windows 11 task manager.